|WritingTask 1
0/150 wordsQuestion
You should spend about 20 minutes on this task. The graph below shows the revenue generated by three major sports industries in the United States over a thirty-year period from 1990 to 2020. Summarise the information by selecting and reporting the main features, and make comparisons where relevant. You should write at least 150 words.
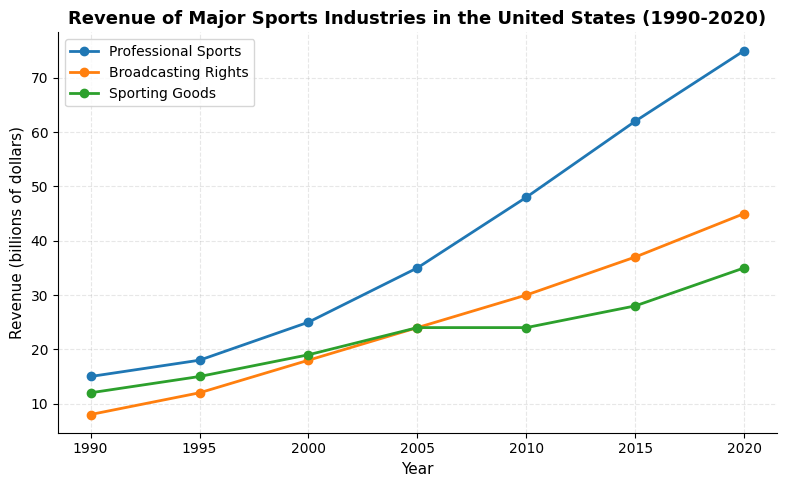
Write at least 150 words. You should spend about 20 minutes on this task.
0 words (min 150)